

In 2014, just before leaving the Federal Reserve, Chairman Ben Bernanke responded to a question about how confident he was in the effectiveness of Quantitative Easing. He replied, “The problem with QE is it works in practice, but it doesn’t work in theory,” which underscores the difficulty of predicting its long term consequences. For over a decade, QE and ultra low rates seemed to help ignite the economy and drive a prolonged recovery. Over the last 18 months, though, the pendulum swung the opposite way: to historically high interest rates and shrinking the balance sheet. QE has now become QT, Quantitative Tightening.
The monetary impact of QT is proving to be at least equally difficult to measure as QE was. Like a wave that can be seen coming from a long distance away, accurately calculating its height and strength can be subjective and difficult. The same can be said of how it will break as it approaches the shore. There seem to be several economic waves starting to show their whitecaps.
Long-term interest rates rose the most last quarter since 2009 and treasury yields are at 16 year highs. Oil prices are back above $90/bbl and recently the US dollar hit its highest level since the turn of the millennium. What does this all mean as we head into the final quarter of 2023 and look ahead to 2024?
From March 2022, when the Federal Reserve first began raising interest rates, to the end of June this year, the one-month T-bill rate rose 513bps while the 30-year Treasury rate rose a more modest 174bps over the same period. This reflected a view that the historic rate increases would slow the economy and break inflation, keeping long-term rates suppressed. In recent months, however, the labor market has remained tight and corporate earnings estimates were raised higher. In July, inflation even reaccelerated for the first time in over a year. This prompted the Federal Reserve to remark that cuts could come at a much slower pace than previously anticipated and long-term yields rose rapidly in response. By comparison to the aforementioned move in interest rates, during Q3 the one-month T-bill rate rose 31bps while the 30-year Treasury rate rose 88bps.
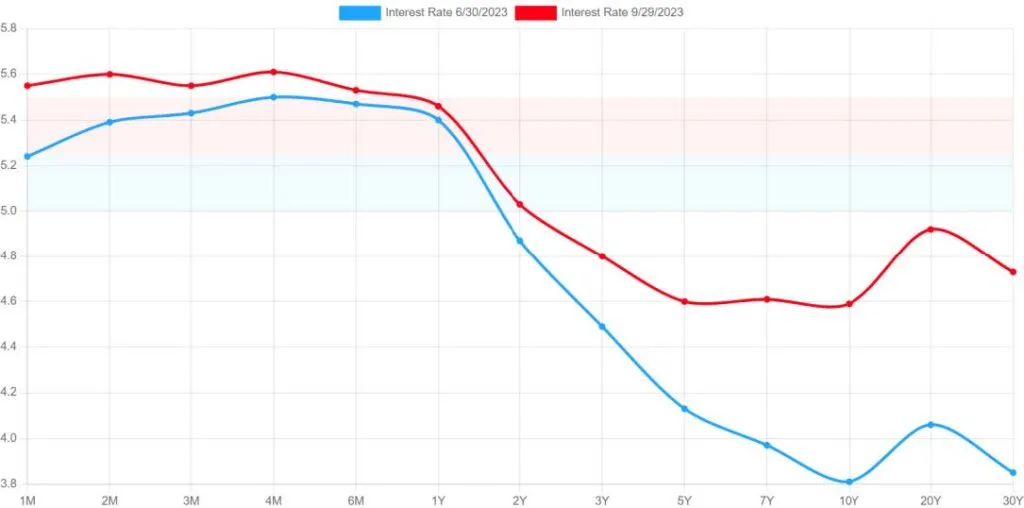
The 10-year Treasury rate garners the most attention. It more directly impacts residential and commercial loans, is viewed as a proxy of broad investor sentiment, and exerts the greatest influence on the stock market. The 10-year rate is approaching a 16-year high of 4.8% and has increased 119bps since the beginning of June. Since 1990, in times of rising rates the 10-year treasury yield and peak terminal Fed Funds rate have generally approximated one another. With the Fed Funds rate still at 5.25-5.50% and another potential hike looming, the 10-year yield may still have room to run. As it continues to rise, markets are likely to remain under pressure.
Fiscal challenges, an issue that has popped up repeatedly in recent months, certainly plays some part in the high level of interest rates. In June, the US raised its debt ceiling just in time to avoid a historic default. In August, Fitch cut the US long-term debt rating to AA+. Then this past weekend, Congress barely avoided another government shutdown. All of these recent issues undermine the credibility of American political leadership in Washington as well as a lack of fiscal discipline.
For this fiscal year ending on Sept. 30, budget experts estimate the deficit will double to $2 trillion from a year ago and the fiscal gap is now hovering near 7%.
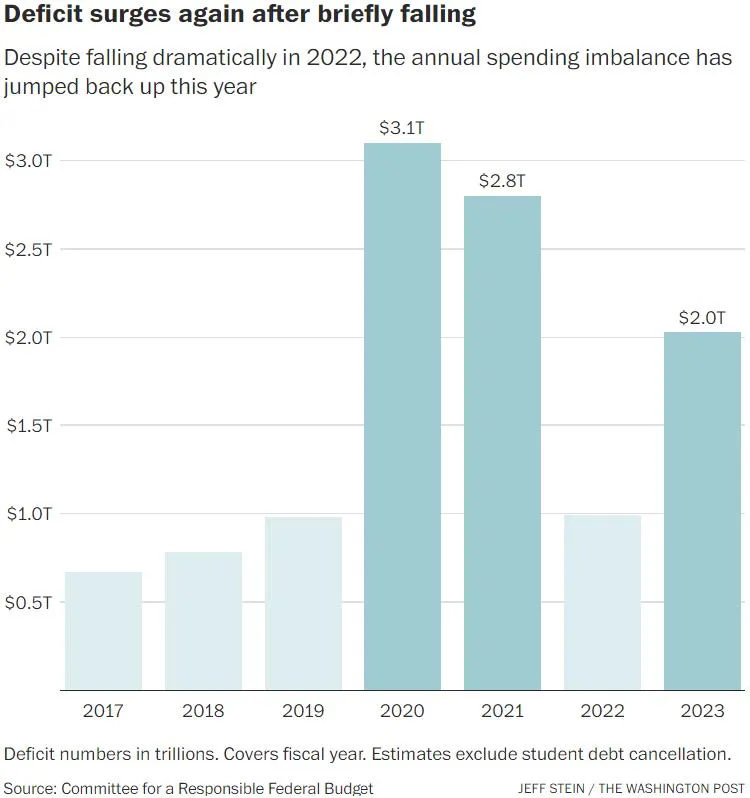
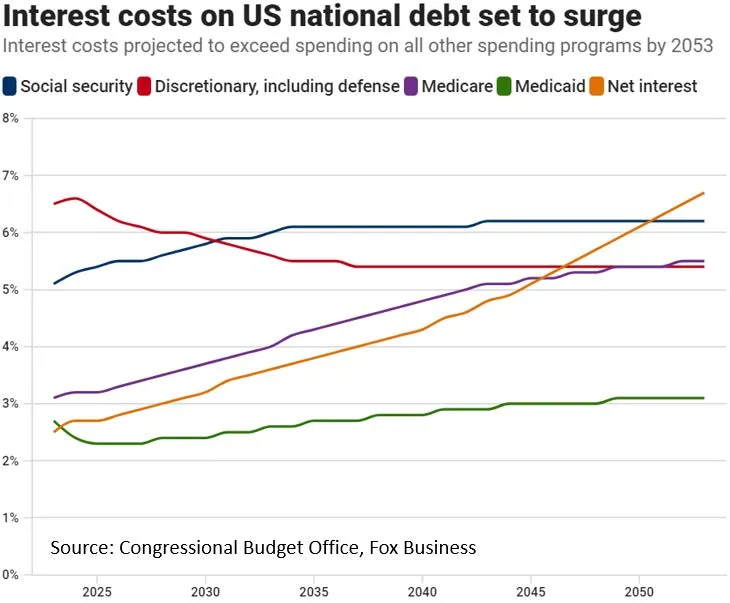
This comes even as the economy has expanded this year, an odd occurrence as such deficits are normally associated with deep recessions, pandemics, or major wars. A combination of Republican tax cuts and high spending from the current Democratic administration has caused the deficit and our debt to spike. Amidst high interest rates, the cost of servicing that debt is set to surge.
By contrast, the Federal Reserve is making earnest efforts to reduce its balance sheet. Compared to the last round of Quantitative Tightening that occurred between October 2017 to August 2019, this round of QT is happening around 30% faster. As of mid-August, the Fed’s balance sheet has been reduced by $757bn.

How far the Fed will reduce its balance sheet from here is unclear. A year ago, many economists predicted the QT program would sunset by the end of 2023. That certainly does not appear to be the case at this point. The speed and length of the QT program will ultimately rest on the resiliency of the economy. It will likely continue as long as the economy can sustain monetary tightening and will slow or halt when the economy eventually seizes up again.
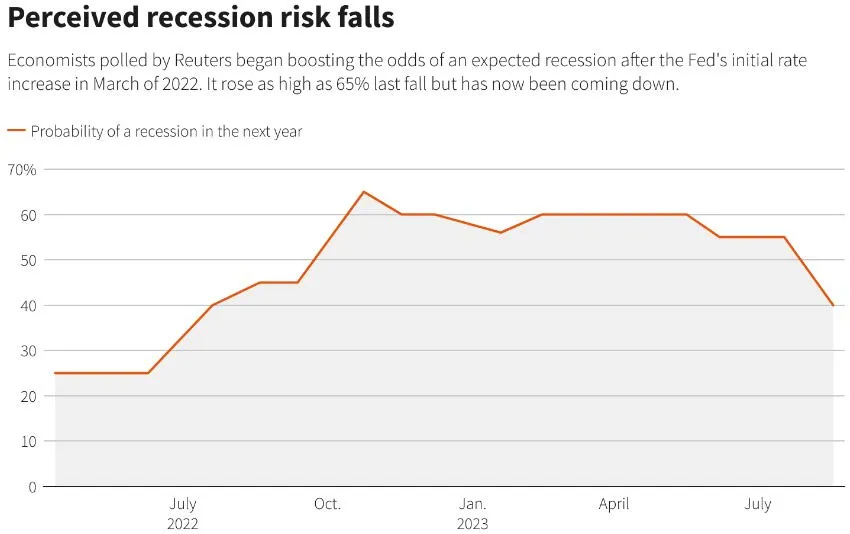
In a Reuters poll last October, 65% of economists predicted a recession in 2023. It seems unlikely to happen that soon for now—the unemployment rate still remains tight at 3.8% and stock analysts have even raised their S&P 500 earnings forecasts for 2024, expecting profits for America’s largest companies to increase by roughly 12% compared to 2023. This has caused analysts to revise down their recession odds. As of October, only 40% of economists now expect a recession in the next year. Even in September, Goldman Sachs cut their recession odds to just 15% over the next 12 months.
In August, the San Francisco Fed published a well-known study stating that American households will deplete their $2.1 trillion of excessive pandemic savings during Q3. At the same time, credit card and auto loan delinquencies are on the rise. As expected, consumer spending is already showing some signs of slowing. In Q2, spending only grew at a 0.8% annualized rate, its weakest pace in five quarters. While all of these factors will likely weigh on US consumers to some degree, household finances may be more intact than many think.
For example, last month household net worth grew to a record $154.28 trillion, up 3.7% from the previous quarter. Also, wage growth still remains high by historical standards. While the rate of growth has been declining, wages still increased by 5.3% in August and continues to exceed the rate of inflation.

Consequently, household debt service payments as a percentage of income also remains low. Redfin estimates 82.4% of homeowners locked in rates below 5% and 62% locked in below 4%, which has insulated many households from the severe rate increases over the past 18 months.
For the most part, US households still remain reasonably well-positioned to service current levels of debt compared to years past.

August’s inflation report showed prices rose 3.7% from a year ago, accelerating a second straight month after 13 consecutive months of declines. The first major culprit driving prices higher is oil. Energy prices rose 5.6% while gasoline prices rose 10.6% in August following Saudi Arabia and Russia’s mutual decision to voluntarily cut production by 1.3 million barrels per day, which they intend to continue through December. The other culprit is shelter costs, which rose 7.3% from a year ago. Housing represents around 40% of the gauge and rose nearly twice as much as the overall reading. Tight supply in oil and housing will likely keep upward pressure on inflation.

Following two straight months of market declines and given the multitude of headwinds surrounding the economy, investors enter Q4 most fearful since the March banking crisis. High rates, expensive oil, a strong dollar, and skepticism around US household financial health has baked plenty of negative sentiment into the market.

At this point, there may be greater risk to the upside if any of these headwinds begin to soften. In any case, investors may do better to swim away from or under the waves rather than find themselves at the center of the break.