
“It is not the answer that enlightens, but the question.”
– Eugene Ionesco
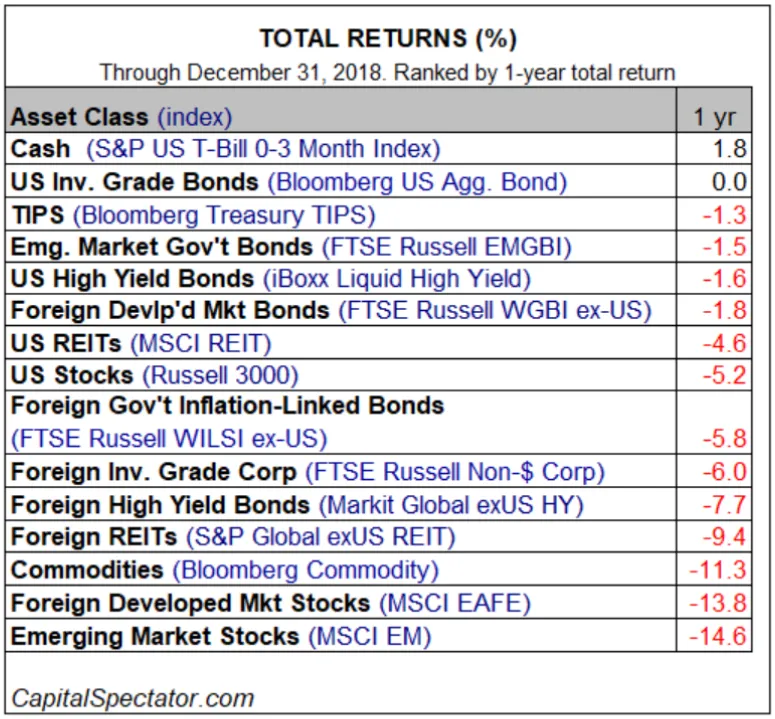
2018 was a particularly challenging year for financial markets with virtually nowhere to hide as nearly every major asset class fell during the year. With cash (US Treasury Bills 0-3 Month) being the only exception, nothing else worked.
In our last newsletter we highlighted some challenges the market could face as investors cope with the quantitative tapering and higher interest rates. For US stocks, the fourth quarter marked the worst quarterly performance for the stock market in a decade and the worst December since 1931. We enter a market in 2019 that offers significantly cheaper stock valuations and better bond yields but face the prospect of slower growth and continued volatility. While the equity selloff is indeed historic, there have been large notable shifts across areas of the market that invite new questions as well as new opportunities.
In our last newsletter we highlighted some challenges the market could face as investors cope with the quantitative tapering and higher interest rates. For US stocks, the fourth quarter marked the worst quarterly performance for the stock market in a decade and the worst December since 1931. We enter a market in 2019 that offers significantly cheaper stock valuations and better bond yields but face the prospect of slower growth and continued volatility. While the equity selloff is indeed historic, there have been large notable shifts across areas of the market that invite new questions as well as new opportunities.
HOW MUCH IS THE ECONOMY SLOWING?
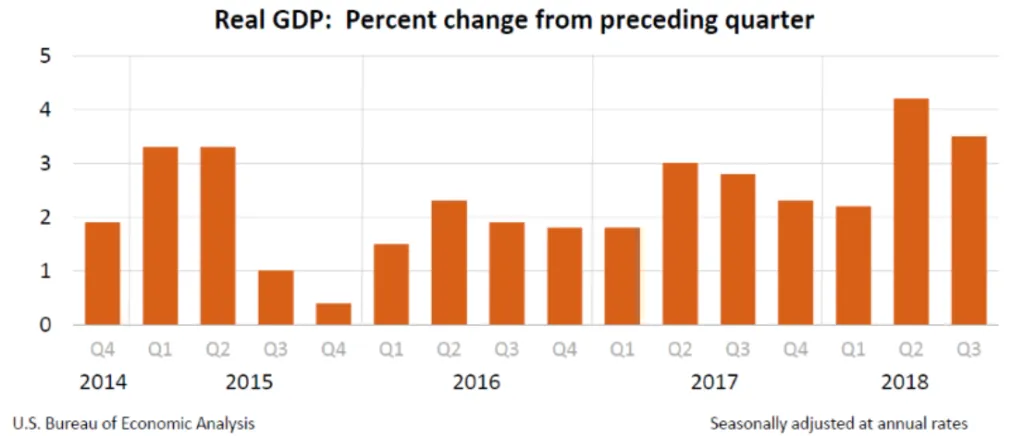
The US economy will likely have grown around 3% in 2018 (4Q GDP data to be released on Jan 30 – estimate 2.7%). The year was helped by particularly strong Q2 and Q3 GDP growth of 4.2% and 3.4%, respectively; supported by a $1.5 trillion tax cut package that boosted consumer spending to four-year highs (personal consumption accounts for nearly 70% of GDP). For 2019, the Federal Reserve (Fed) reduced its GDP growth forecast from 2.5% to 2.3%. Some other analysts have been more pessimistic—for instance Goldman Sachs reduced their estimate from 2.4% to 2.0% for 2019. While 2% growth would be considerably slower than 2018, this pace of economic expansion is fairly normal over the last two decades (the economy has grown at 2.02% on average since 2000). The more worrisome scenario is if growth slows considerably from 2020 and onward, which could be dependent on a variety of factors such as Fed policy, trade tariffs, and/or a major slowdown internationally.
Domestic employment data remains very strong, with the current unemployment rate at just 3.9% (traditionally 5% and below is considered full employment). In December the US economy added 312k jobs, which was a major upward surprise (consensus forecast was +177k) and wage growth hit 3.2% for the year, marking the largest full-year increase through this expansion. In total, 2.64 million jobs were added in 2018, making it the best year for new jobs since 2015.
HAS THE FED PLAYED A ROLE IN THE RECENT MARKET SELLOFF?
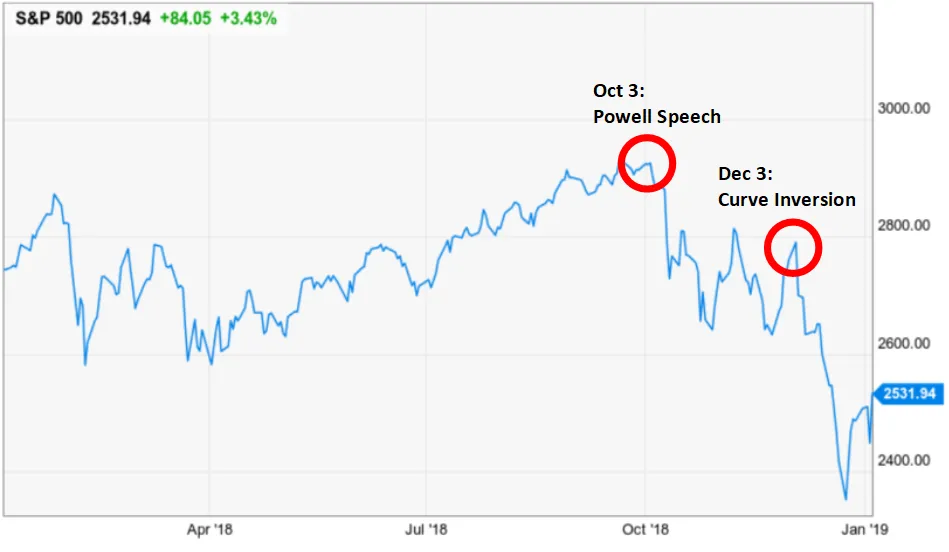
While a combination of factors can be attributed to the recent market weakness, a specific comment on October 3 from Fed Chairman Jerome Powell arguably sparked the selloff. He said in a speech that day that interest rates were a “long way” from neutral, which sent bond yields to 7-year highs and sparked a strong selloff in stocks in the subsequent weeks. This seemingly hawkish tone pushed short-term rates higher relative to long-term rates and not only caused the yield curve to further flatten but actually invert between the 2-year and 5-year points on December 3, which ignited an even bigger selloff into the end of the year.
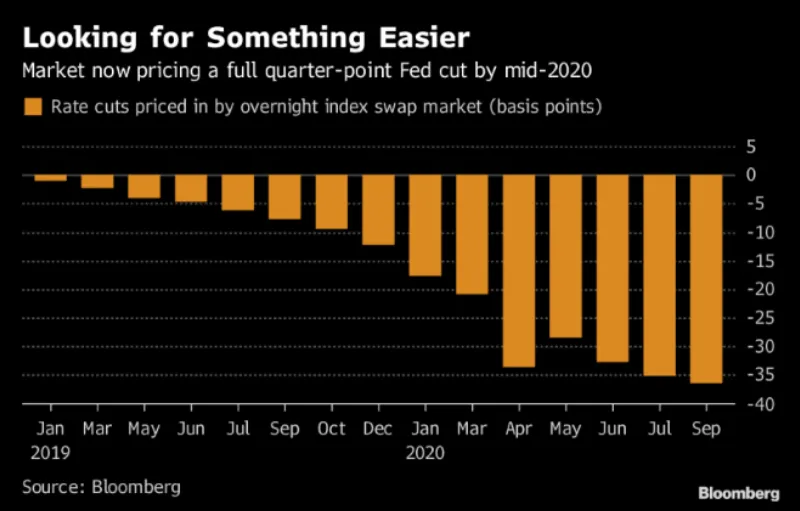
Mr. Powell has since changed his tone dramatically. After hiking rates in December (a controversial decision), he has since said the “Fed will be patient” in mulling over further rate hikes and even said the Fed is willing to halt quantitative tapering if it causes problems for financial markets. In recent weeks, rates have pulled back significantly. The 10-year treasury yield has fallen back to below 2.65% after hitting a 7-year high of 3.23% on October 5. At this point not only is the market not pricing in a full rate hike for 2019, it is pricing in a 0.25% rate cut by mid-2020.
HAS THE MARKET ACTUALLY GOTTEN CHEAPER?
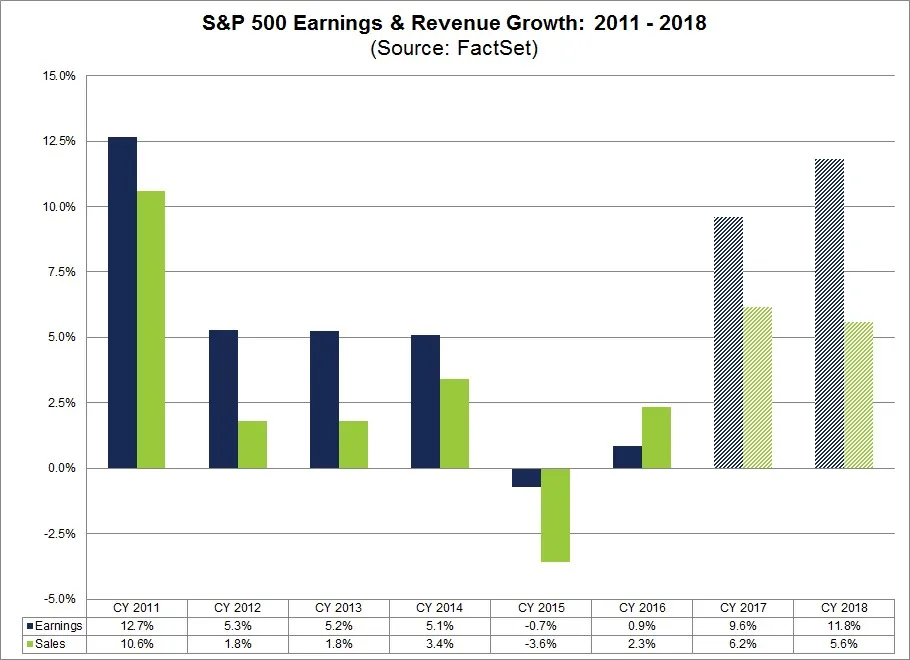
Based on current 4Q forecasts, the estimated S&P 500 earnings growth rate for 2018 is 20.3%, which would mark the highest annual earnings growth for the index since 2010. While it is true that the corporate tax reduction contributed significantly to higher earnings in 2018 (estimated earnings for 2018 increased 7% during the three-month period of Dec 2017—Feb 2018 around tax reform), 2018 revenues also grew 8.9%, which would mark the highest year-over-year increase since 2011. Furthermore, while stock buybacks hit a record announced $1.1 trillion for the year, dividends paid by S&P 500 companies totaled $119.8 billion in Q4 (a quarterly record) and $456.3 billion for 2018, up 8.7% from 2017.
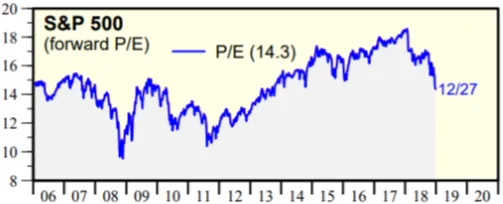
Nevertheless the strong corporate profits, large share buybacks, and high dividends did nothing to prevent the market from suffering losses in 2018, which naturally leads one to assume the exceptional performance was already priced into markets earlier in 2017. While that is very likely at least partially true, at current levels the S&P 500 is at its cheapest valuation since 2014 if current forecasts hold. The current forward 12-month price-earnings (P/E) ratio is 14.3, which is below the 5-year average (16.4) and the 10-year average (14.6).
HOW MUCH ARE THE TRADE TARIFFS AFFECTING THE REAL ECONOMY?
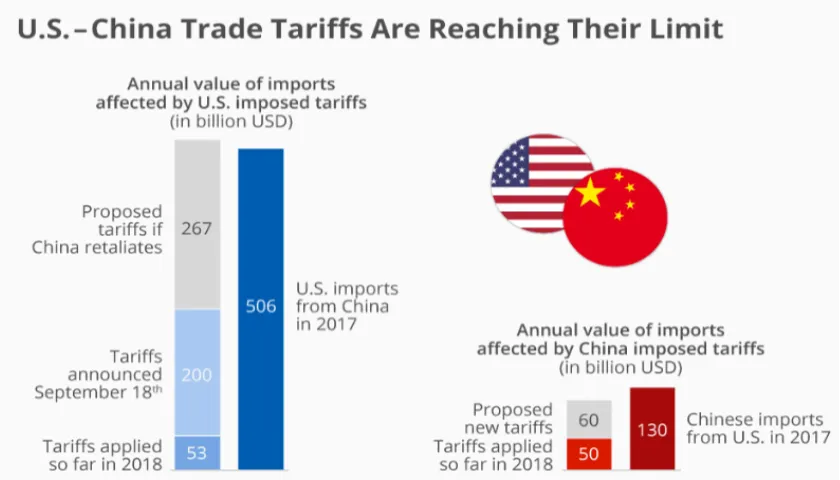
The trade tariffs have reduced exports and frontloaded imports, widening the country’s trade deficit. Based on the Q3 GDP data, the economic impact of the tariffs appears meaningful. Exports fell due to a decline in soybeans shipped to China after Beijing’s tariffs immediately took effect, while the threat of 2019 US tariffs accelerated 2018 imports into the US. The net trade contribution to GDP for Q3 (most recent report) came in at –1.99%, which was the largest negative contribution in over 34 years (Q1, 1984). If trade had matched its average contribution since 2015 (-.33% drag), growth would have been 5% instead of 3.4% (actual Q3 GDP).
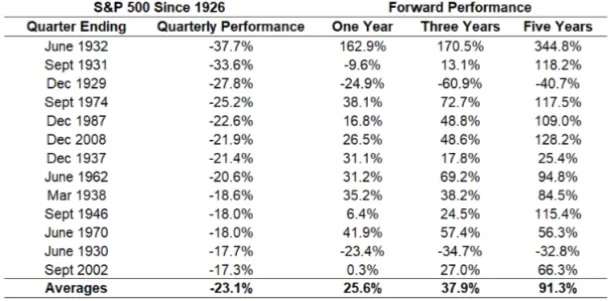
HOW HAVE MARKETS PERFORMED AFTER BAD QUARTERS?
In Q4, the S&P 500 fell 13.6%. While past performance alone does not offer certainty for the future, history has shown that usually investors are compensated for being patient after a tough quarter. With the exception of the Great Depression years of 1929-1931, the market has been flat to positive in every instance in the subsequent 12 months following the 13 worst quarters since 1926. The forward 3-year and 5-year performances are also shown below.
WHAT THINGS SHOULD I WATCH FOR AT THE START OF 2019?
- 4Q Earnings – Apple’s recent revenue warning sent shockwaves through markets. The company lowered its 4Q revenue forecast from $91 billion to $84 billion, citing a collapse in iPhone sales in China. While a sliding yuan and a slowing economy has caused Chinese luxury retail to suffer, there is the risk that other companies may face similar challenges to that of Apple. We are watching if other companies announce similar profit warnings that will require changes in earnings assumptions.
- US/China Trade Negotiations – This week US and China leaders began trade negotiations in Beijing. While we do not believe anything short of an actual trade agreement will serve as a positive catalyst for financial markets, leaders on both sides have expressed constructive comments thus far. A trade deal could include large increases in Chinese purchases of US soybeans and natural gas as well as structural changes in China’s foreign business policy that would allow non-Chinese companies to compete more equitably in mainland China.
- Federal Reserve – Coping with a flat yield curve and limited inflation, financial markets want to see the Fed remain patient and data-dependent with respect to its monetary policy. While the curve remains flat, financial markets will likely not react well to comments from Fed members alluding to looming rate hikes or unwinding the quantitative easing program.
HOW IS PRUDENT APPROACHING 2019?
PIN made some adjustments to its portfolios in mid-November to cope with the increased risk in the market, shifting some of its exposure away from more expensive outperforming segments of the market into areas that have lagged. We are sensitive to the risk of lower corporate profits than is being priced in by markets, the threat of an over-aggressive Fed, and the possibility that the US and China are unable to agree on terms to stabilize global trade. In the event of any of these scenarios, we stand ready to adjust accordingly.
It is our aim to remain objective in our risk management. For now we see cheaper stock valuations, low interest rates with a once again more accommodative Fed, two countries in the US and China that should be sufficiently motivated to negotiate a trade agreement, and decent economic growth. Following this major correction in recent weeks, we see more reasons to be positive than negative.